Survey Results
Faculty Attitudes, Confidence and Behaviors with Diverse Doctoral Students
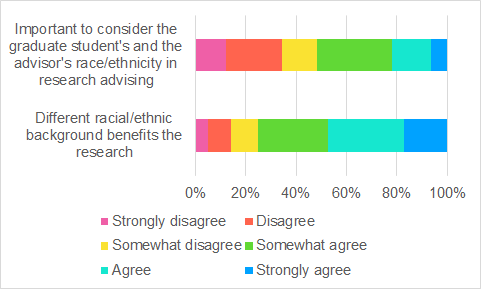
Nearly 75% of faculty somewhat agree to strongly agree with the statement that “different racial backgrounds benefit research”. In contrast, 48% of faculty somewhat disagree to strongly disagree with the statement “Important to consider the graduate student’s and the advisor’s race/ethnicity in research advising”, i.e. half of our STEM faculty take a color evasive approach to advising doctoral students.
Impact of Graduate School Experiences on Under-represented (URM) Students’ Faculty Aspiration
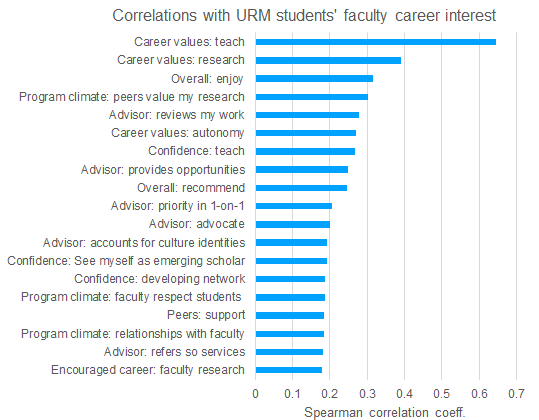
The strongest positive correlations between URM Ph.D. student interest in a faculty career are when students highly value teaching, followed by research values. Correlations also indicate the importance of the proximal environment of a positive climate provided by peers and faculty, and positive advising behaviors. Self-efficacy and confidence measures are less correlated with interest in faculty careers, and an even smaller role for outcome expectations in determining URM Ph.D. interests in faculty careers.
Climate Survey (Iowa State University)
(More data will be added when other universities complete their surveys.)
- 35% of the graduate population reported negative experiences in their graduate program based on their personal characteristics. The most frequent types of negative experiences were based on gender (12%), race/ethnicity (10%), age (7%), and country of origin (6%).
- 38% of students reported personally experiencing bias/harassment/discrimination in the form of verbally offensive comments. Minoritized populations reported the following higher rates of verbally offensive comments: 75% of transgender and gender non-conforming students, 56% of LGB students, and half of the students of color: 49% of students of color (74% of Black/African American students, 50% of Asian American students, 40% of Hispanic/Latino students).
- 28% of students indicated feeling that their ideas/suggestions in an academic/research discussion were disregarded because of personal characteristics.
- 13% reported feeling threatened verbally or physically. Minoritized populations and international students reported the following higher rates of feeling threatened; 40% of transgender and gender non-conforming students, 24% of women students, 19% of international students, and 19% of LGB students.